In the past, our lab facilities have been used to assist the Wabana Chain of Lakes Association with water quality monitoring for nutrients and algae. Most recently, we have been monitoring the loss of oxygen from Wabana Chain waters and have growing concerns about increasing bacteria that may be of human health concern.
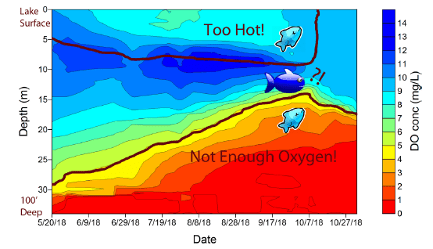
Oxygen in deep waters
Lakes with low nutrients, like the Wabana Chain of Lakes, should have ample oxygen for fish to live both in the deep cold waters and at the surface. However, observations using water profiling equipment have shown that most of the Wabana Chain lakes have insufficient oxygen below about 30 feet of depth my mid-summer. This, coupled with warming surface temperatures, makes it tough for cold-water and cool-water fish to find a place to live anymore.
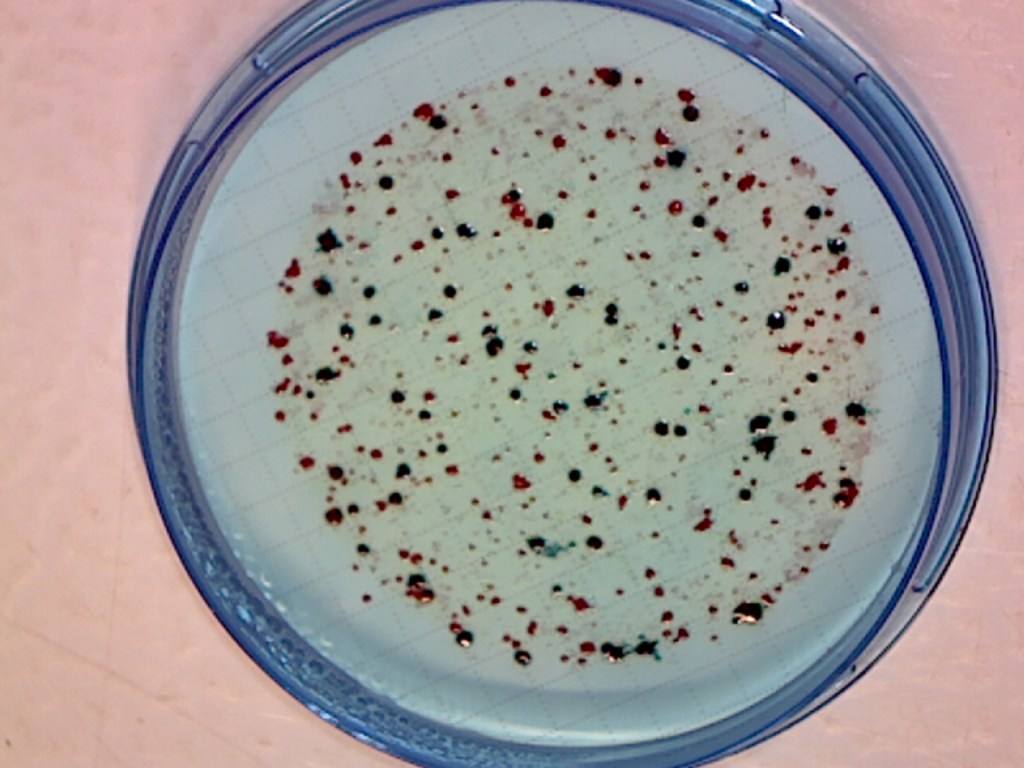
Fecal Coliform Bacteria and E. coli
Twenty years ago, Bill and John Downing tested many places in the lakes for the kinds of bacteria from human sewage and septic systems. They found several places in the lakes where bacteria counts were quite high. This stimulated the Wabana Chain of Lakes Association and Wabana Township to launch a program of septic system inspection. The program was successful and several defective septic systems were identified and replaced.
Because the life expectancy of a septic system is something less than 30 years, normally, it seemed to us a good time to begin testing some of the waters for fecal coliforms and E. coli again. John Downing began a pilot program in summer 2022, finding several places around the lakes with concentrations of E. coli that were very high. In a few places, coliforms were high enough that they could have resulted in beach closures under EPA mandates. Sampling is set to resume again in the near future.